Debugging
Last Updated: 05 May 2021Debugging is one of the most important stage while developing an app. It is recommended to keep an eye on this while developing.
With the Debugging feature enabled, you can keep a track of everything happening with the requests you sent to your Firebase Server from Construct 3, whether they have been processed successfully or if there was any error, or some note that would enhance processing speed.
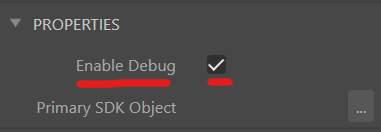
1. Enable Debug in Firebase SDK Plugin
- Go to Firebase SDK Plugin Properties
- Enable Debug

It is recommended to turn this feature off when exporting for the final/public release of your app.
2. Open up the JavaScript Console
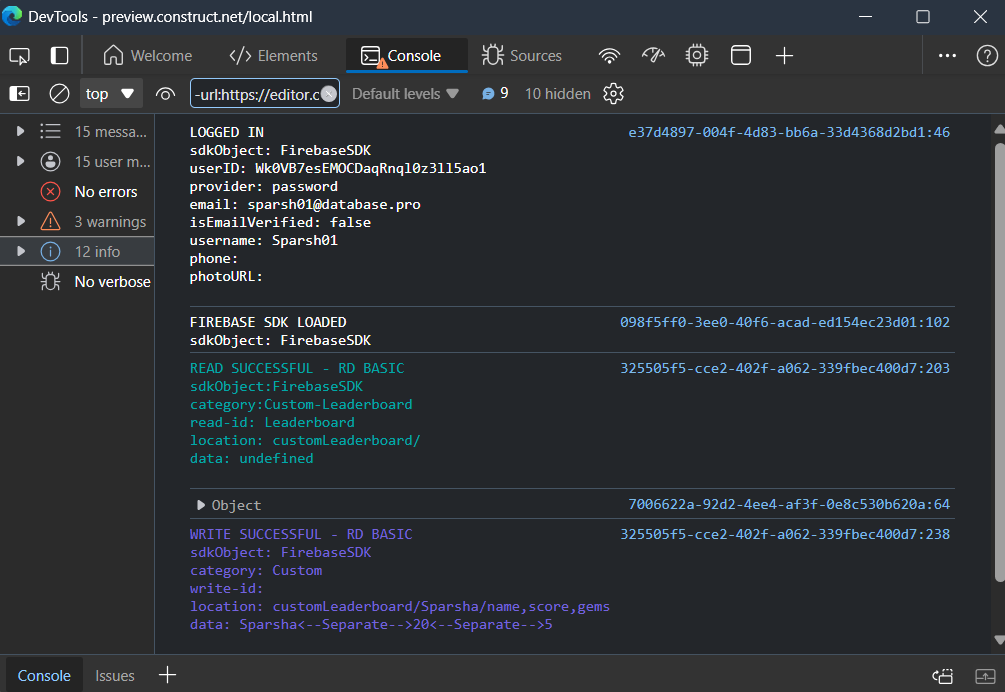
- METHOD 1: Browser DevTools
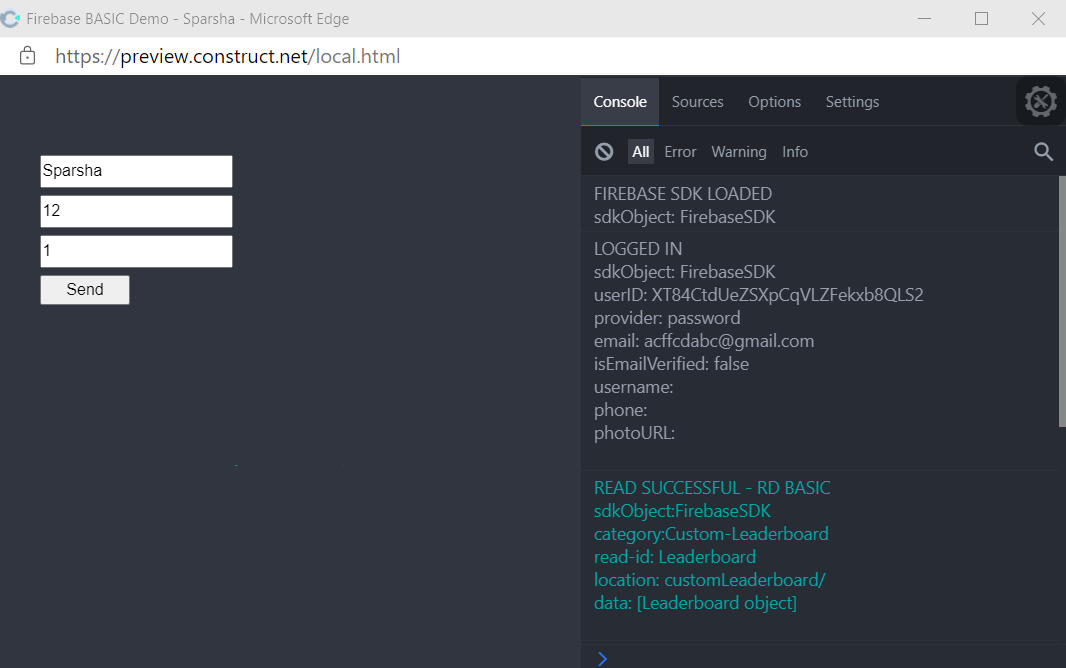
- METHOD 2: Eruda Console Plugin
The JavaScript Console is located in the Developer Tools of your browser.
(In Windows) During preview, click on your Preview window, and then simply Press F12 or Ctrl+Shift+J and Go to the "Console" Tab.

This plugin provides an easy way to debug on Android and iOS
Simply add Eruda Console Plugin to your Project to start Debugging.
Disable Worker Mode for this to work. (Go to Project Properties > Advanced > "Use Worker": "No")
Plugin Link: https://www.construct.net/en/make-games/addons/551/eruda-console-no-worker
